
Resource Management Using Microsoft Project

I always enjoy reading emails from project managers who implement Microsoft Project techniques. I received an email from an employee at the United States Central Command asking about using Microsoft Project to track personnel on a military base and monitor resource levels as units deactivate during a base closing. The goal was to measure the total personnel at any given time and track the resources as the base downsized.
To produce this information, I developed a quick resource management model in Microsoft Project. Since Microsoft Project supports resource assignments and resource pools, developing an ongoing model was relatively easy. This example creates a work breakdown structure (WBS) that comprises teams or units allocated to different tasks.
Develop the WBS
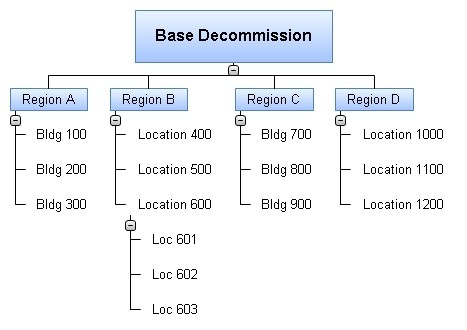
The first step is to develop a WBS that resembles the location hierarchy. I like to think visually before detailing the work in Microsoft Project, so I used Matchware MindView to create a hierarchical WBS (Figure 1).
The base (the top-level WBS deliverable) was divided into regions. Each region was composed of specific buildings, further defined into particular floors. The term “location” could also be used if resources were not assigned to a specific building but to another ambiguous sub-region. The level of detail can be extended to individual offices or cube locations.
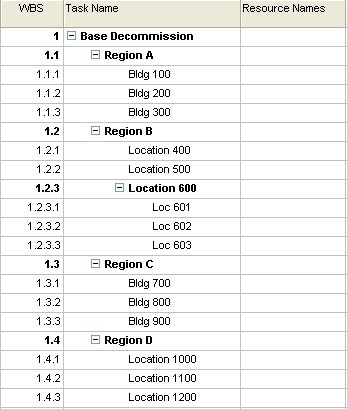
Once I had a visual breakdown of the base locations, I exported the model into Microsoft Project. I could have used MindView to assign resources and dates, but I chose to detail the WBS further in Microsoft Project (Figure 2) due to the number of resources that would be added to each location or building.
Set the project start date
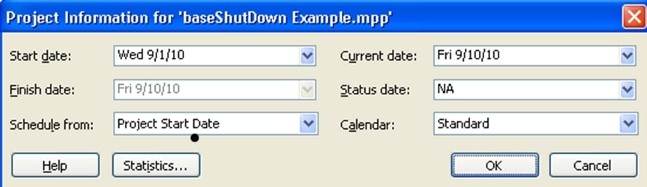
As each location is assigned a decommission date, you’ll want to have the correct project start date in Microsoft Project. To set the project start date, go to Project | Project Information (Figure 3) and select the desired Start Date from the drop-down menu.
Define the resource pool
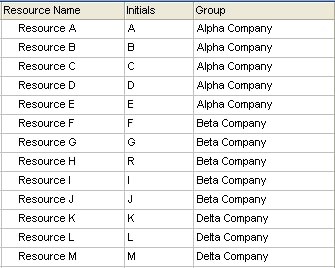
The next step is defining all the resources currently occupying the base. Since this could extend to several hundred or thousand resources, you may want to import them from an Excel extract of a resource management system. Follow these steps to customize the resource sheet:
- Go to View | Resource Sheet.
- Right-click these columns and select Hide: Type, Material Label, Max Units, Standard Rate, Ovt. Rate, Accrue At, and Code.
- Enter a name and a team name in the Resource Name and Group column (Figure 4).
Assign resources to locations
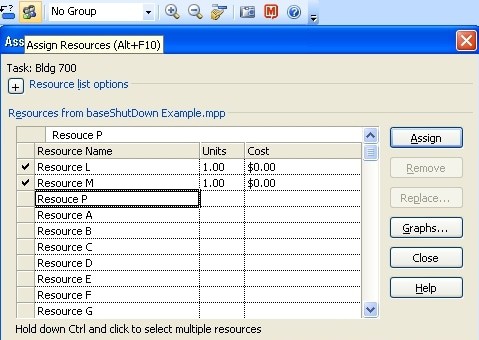
Now, you should switch back to the Gantt Chart view and assign resource names to the specific buildings in the WBS. You can assign resources by selecting the names from the Resource Name column or using the Assign Resource dialog box. Click the task and press [Alt][F10] to display the resource box (Figure 5).
Assign location to decommission dates
With your resources assigned, the next step is to enter the duration of evacuation of the building or select a target finish date. If this is a simple planning scenario where a specific building will be decommissioned, then a Finish date would be chosen. If each building has building dependencies, task predecessors may be used.
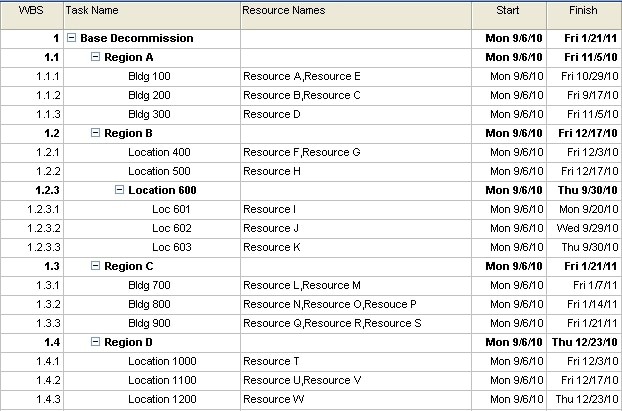
It is assumed that all the resources are assigned to the building at the start of the project, so all tasks should have the same Start date. By selecting the decommission date, the Finish date will be populated. Figure 6 depicts the completed schedule with target dates.
Set up the resource graph
The final step in setting up the model is to change the resource graph.
- Go to View | Resource Sheet.
- Go to Window | Split.
- Click the lower window pane and select View | Resource Chart.
- Right-click the Resource Graph and select the Peak Units graph.
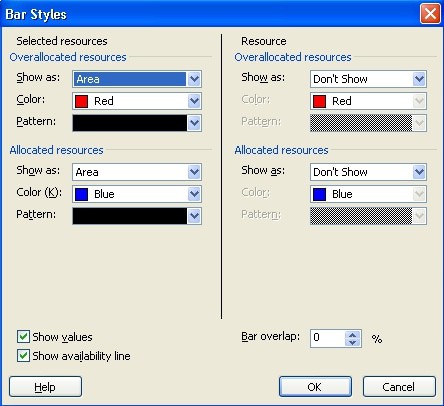
- Right-click the Resource Graph and select Bar Styles.
- Under the Selected Resources section (left side), change the Overallocated and Allocated Resources Show As options to Area.
- Under the Resource section (right side), change the Overallocated and Allocated Resources Show As options to Don’t Show.
- Confirm the options are the same as in Figure 7 and click OK.
View the resource management model
You can view the resource ramp-down curve over time with the resources selected and assigned to specific buildings. You can view the resource allocation over time by clicking the magnifying glass in the lower resource graph pane. Selecting multiple resources in the upper pane resource sheet allows you to view the specific resource curve for each resource in the model (Figure 8).
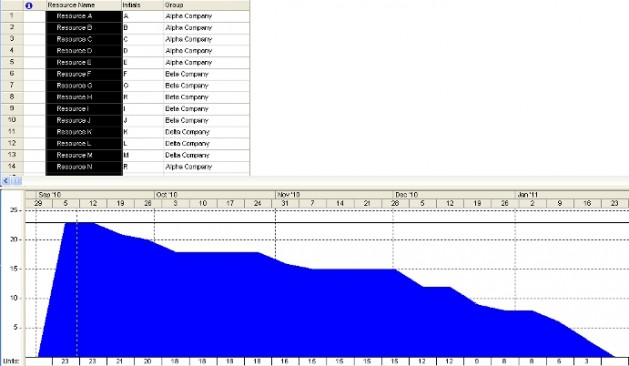
The horizontal axis of the resource curve provides the resource count over time. Over the five months, the graph starts with 23 resources and gradually reduces to zero when the base closes. The horizontal line at the top of the graph represents the original resource level at the start of the project. By adding more resources and filtering on specific team names, project managers can view individual, team, and entire resource pool curves.
Recommended articles: Microsoft Project Tutorial: How to Track Percent Complete | Finding Late Tasks with Microsoft Project Custom Filters | How to Calculate Earned Value in Microsoft Project