
Confluence Tutorial: Build a Project Portfolio Dashboard

In this Atlassian Confluence tutorial, you’ll learn how to build a project status dashboard in 3 easy steps
Atlassian’s Confluence product is a potent and flexible collaboration tool that enables distributed teams to build better software products. Confluence is a single collaboration tool where teams can organize, create documents, and discuss project work in one place. Using Confluence, project teams can develop product documentation, track meeting minutes, draw process flow diagrams and mind maps, and even create technical architecture documents. In this article, I’ll show you how to build a project portfolio dashboard to manage your projects or programs in a portfolio.
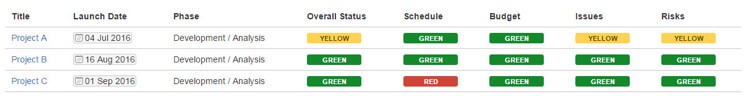
Below is a sample snapshot of a small program with 3 projects. Using Confluence’s graphical indicators, I can assess each project’s health in terms of status, schedule, budget, issues, and risks with one glance.

If I click on the project title, I can drill down to the specific status report for further analysis. The benefit of this solution is that program managers can roll up individual status reports into summary-level reports. If the underlying status report changes, the dashboard is automatically updated. To create a project portfolio dashboard, follow these steps:
Step 1: Create individual status reports
Step 1.1 Create a table in Confluence and format using the heading column icon.

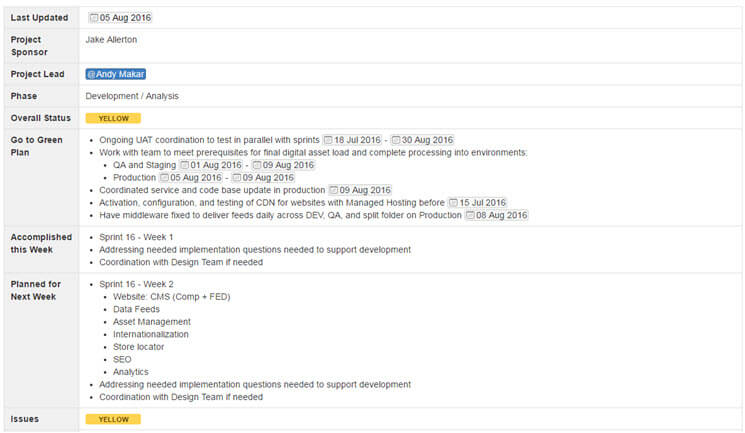
The table can mimic the fields on your company’s current status report template. Confluence is flexible, so feel free to modify the format as necessary. Status can be entered just by typing text or content in the cells. If you want to tag someone, use the @ sign shortcut and tag them. If you’re going to specify a date, use the // shortcut key.
Below is the sample status report.
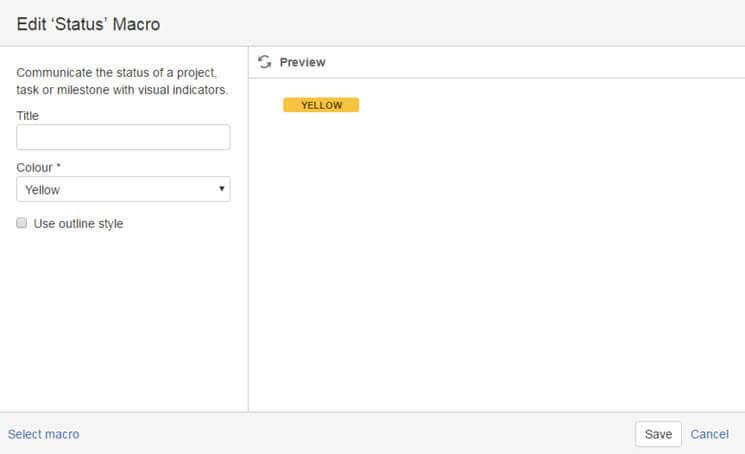
Step 1.2 To add the Status indicators, click the Insert Macro icon in the toolbar and insert the Status macro.
Format the macro with the desired text and colors.
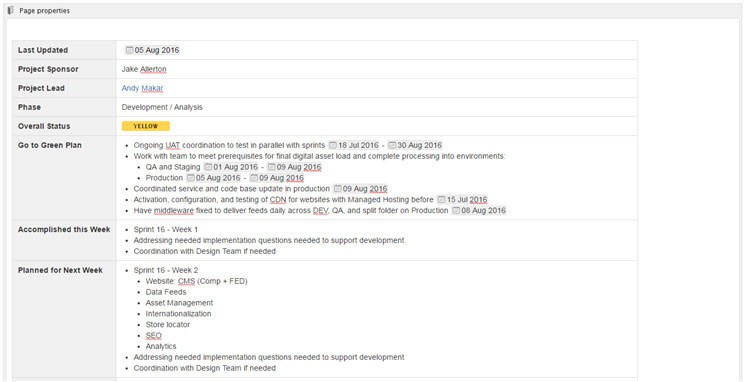
Step 1.3 Insert a Page Properties container
You’ll insert a Page Properties macro below the status report. It is okay if it appears below the status report since you’ll be cutting and pasting the table into the container in the next step.

Step 1.4 Cut and paste the table into the Page Properties container
Step 1.5 Add a label called “status” to the page
Adding a label is easy. Assuming you’re in edit mode, click on the tag icon after the page title.

If you’re not in edit mode, you can always press “L” and the same label dialogue will appear.
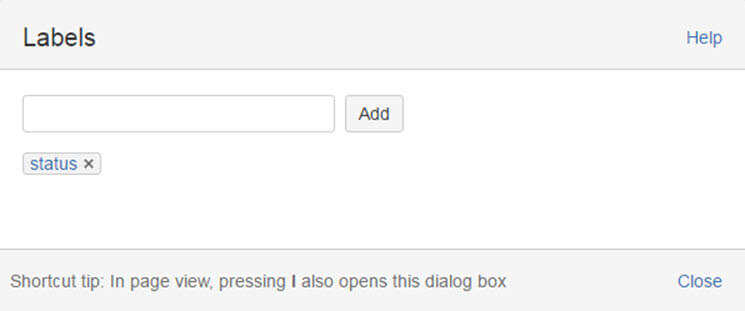
Step 1.6 Enter the word “status” for the label, press add, close the dialog box and save the page.
Congratulations—you’ve created your first status report template. If you think you’ll be rolling out this template throughout the organization, you’ll want to create a global page template in Confluence so others can benefit from your hard work.
Step 1.7 Repeat creating status reports for every workstream or project in the program or portfolio
It quickly becomes a copy-and-paste exercise!
Step 2 Create the Portfolio Page
After creating the individual project status report pages, you want to create a portfolio page that displays the summary view of individual status reports. I prefer to keep all status reports in a single-page hierarchy, but you could distribute this template across Confluence pages and spaces and still develop a portfolio view across multiple pages.
Step 2.1 Insert a Page Properties Report Macro
The Page Properties macro displays a table of pages that contain the Page Properties macro and a specific label. The table links to each page and displays specific columns from the status report.
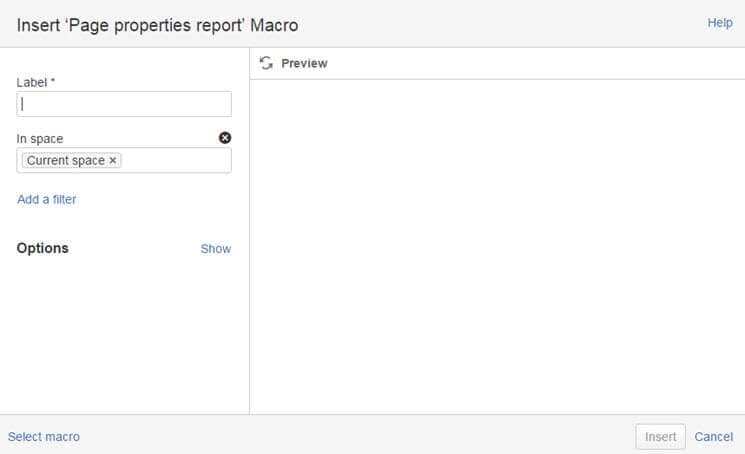
Step 2.2. Enter the label “status”
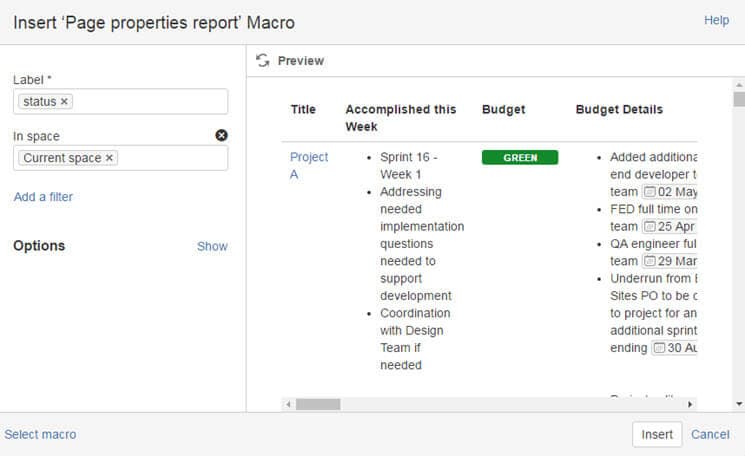
The report must be tailored only to include specific columns on the portfolio status page.
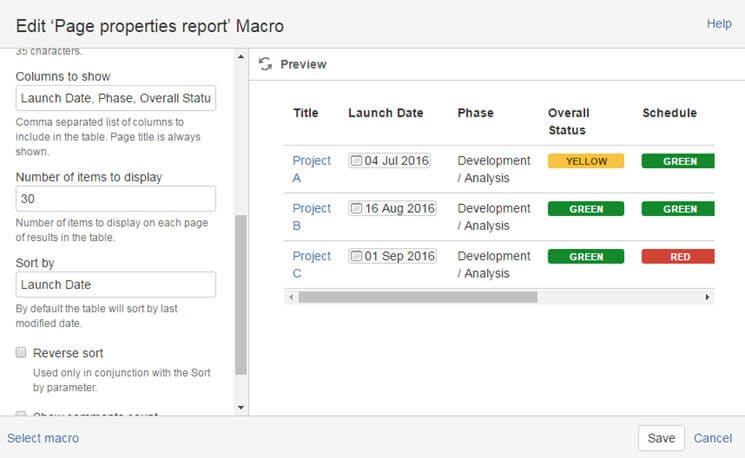
Step 2.3 Click Options – Show and enter the following columns: Launch Date, Phase, Overall Status, Schedule, Budget, Issues, Risks
If you have many reports, you can limit the number of items displayed by providing a numeric value. I would also like to sort by launch date. Click the Preview icon to refresh the report summary.
Step 2.4 Click Save to Close the dialogue and Save the page
Step 3 Review the completed Dashboard
With a few clicks, you’ve generated a complete portfolio dashboard with the key traffic light indicators. Remember any row in the status report can be pulled into the summary view by simply typing the field name in the Page Properties report.
It may not seem like much, but getting real-time visibility into a portfolio instead of consolidating PowerPoint-driven status reports or having to resend a new status report with a last-minute change is a time saver. Imagine the time saved if you were running a PMO and had to review 60 projects each week.
In my next Confluence tutorial, I’ll show you how to track a list of action items for headache free meeting minutes!