
Improving Project Status Reports with Visual Reporting
Google has over 13 million pages that describe project status reports. If you read all of them, you’ll find many discussions on the purpose of status reporting, key components, and numerous templates. I’ll save you the time of reading 13 million pages and provide three useful formats to include in your project or program status report deck. The key to these formats is to use visual reports to convey status rather than reading lengthy missives on this week’s project status.
My unscientific observation is people skim rather than read an entire status report or presentation. I’m sure you’ve had the experience where an executive, customer, or key stakeholder skims through the first few pages of your meticulously worded presentation only to stop at the one key slide that interests them. The entire purpose of the status report is to inform the project stakeholders of the project’s progress and have a conversation about the scope, resource, and timeline concerns. Conversation using paragraphs of text is difficult for both the presenter and the audience. Visual formats help make the conversation easier.
I’ve always enjoyed a visual one-page status report that conveys the overall project status. Clark Campbell even wrote two books on using a one-page status report for information technology and non-IT projects. Be sure to check out The One-Page Project Manager: Communicate and Manage Any Project With a Single Sheet of Paper and The One Page Project Manager for IT Projects. I’d also readily admit a one-page status format may not meet all stakeholder communication needs. I’ve used the following one-page visual reporting formats to address different communication needs and improve the status reporting.
Work Breakdown Structure Project Status Report
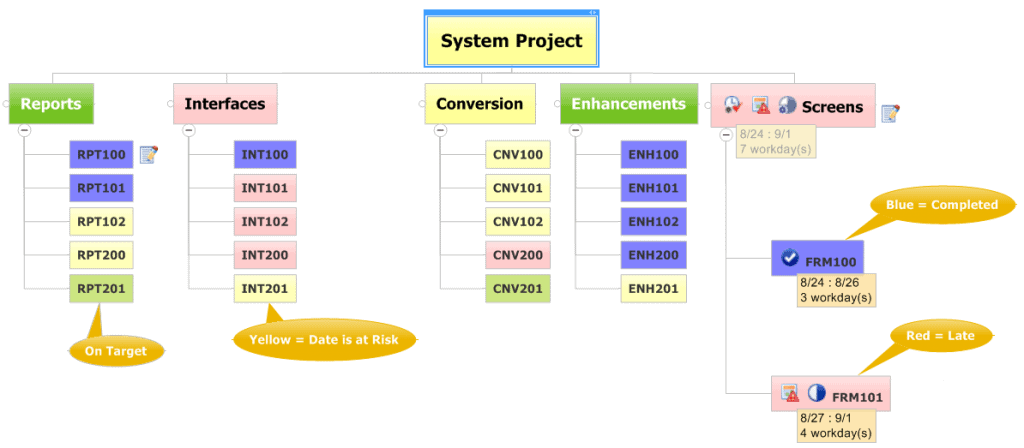
The figure below depicts all the reports, interfaces, conversion programs, enhancements, and forms (or screens) required to be developed in a systems project. Each deliverable in the WBS can be color-coded based on progress, issues, and risks. Blue indicates a completed deliverable, yellow indicates an at-risk deliverable, red indicates a late deliverable, and green means the task is on schedule.
A glance at the graphical WBS suggests the project’s interfaces and screen development have the most significant number of problems, and the conversion branch is also at risk. By adding a visual layer to summarize the status quickly, project teams can focus on the issues affecting the impacted work.
The graphical work breakdown structure was developed in Mindjet MindManager. Using MindManager, project managers can import MS Project data, assign task start and end dates, and display red and yellow indicators based on the current date. I’ve used this visual status reporting format on larger programs and found it helpful in summarizing the status of complex projects within a program.
A Graphical Timeline View
Every project status report needs a time-phased Gantt chart to indicate progress against due dates. Before MS Project 2010, Gantt chart reporting was challenging in that it was difficult to easily depict meaningful tasks in a graphical one-page view. Fortunately, with MS Project 2010, you can create a timeline view and add select tasks rather than adding every task or milestone in the project.
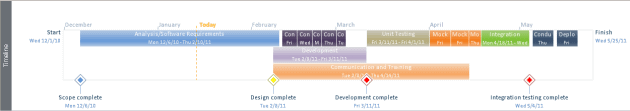
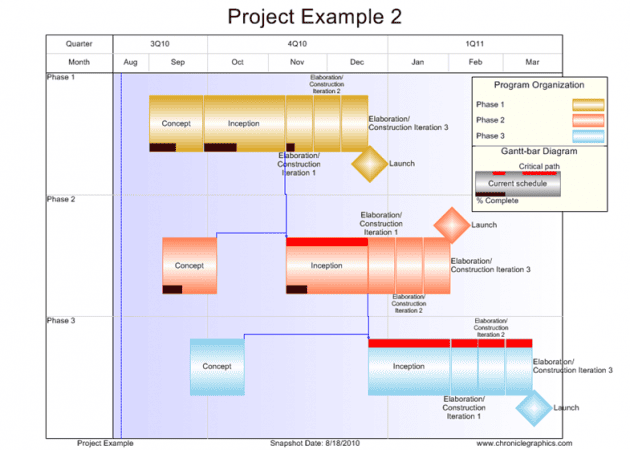
The timeline view is helpful. However, large-scale projects and programs often have many workstreams and phases that require an integrated view. MS Project 2010 users can create multiple timeline views and embed them in a single PowerPoint slide, or a manual phased-based Gantt chart can be made in Visio, Excel, or another graphic program. The challenge with these solutions is they all require tedious graphic manipulation when the project data changes. If you are looking for a configurable, one-page snapshot based on your project schedule, look at the Chronicle Graphics OnePager Pro tool.
With OnePager Pro, I can quickly develop a one-page snapshot, report baselines, critical path, % complete, and add my own annotations. If the underlying project data changes, I click a button, and the graphical data is updated. Try doing that with a complex chart in MS PowerPoint, and you’ve just wasted another hour tweaking and shifting data and Gantt bars manually.
My One-Page Project Status Report
If I had to include one slide in a status reporting deck, I would use this format. The format combines text and graphical indicators that include subjective sections and objective metrics like SPI and CPI. By combining the achievements, top issues, risks, and schedule, stakeholders receive a comprehensive view of the project in one status report.
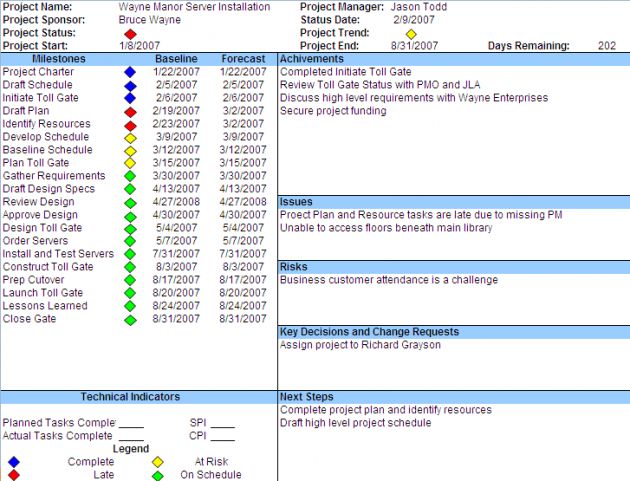
I’ve used this project status report template for small projects, large projects with several workstreams, and large programs with many sub-projects. By assigning one page to each workstream in the project, the project manager gets a consolidated view of all the work in the project. As new scopes or phases are added, another one-page sheet can be appended to the status reporting deck.
Once I have the various one-page snapshots assembled, I insert the images into a Microsoft PowerPoint presentation in the following order:
- Title Slide with date and presenter
- Status Based WBS (Figure 1)
- Graphical Timeline View (Figure 2 or 3)
- One Page Status Report (Figure 4)
- Appendix
- Detailed Issue, Risk Log
- Summarize Project Schedule
- Budget Detail
For each project in the program, additional one-page status reports are added. Adjust the slides based on your audience’s needs. Thinking visually and communicating in visual formats help comprehension and communication. Pick one of these reporting formats and test it out in your organization.